fbpx

TL;DR | 2018 Yellow (the artist formerly known as Sensis) Social Media Report | Part 2

Part 2 – Getting Down to Business

I was going to call it report-ier in reference to Die Hard – but decided not to. Anywho, part two of the Yellow Social Media Report is out and I’ve got to say it’s really got 3 main takeaways. If you missed my wrap-up of Part 1 you can read it here.

I could drag it out and fill this blog post with all manner of stats and insights, but unless you’re a Social Media Advertiser you’re probably not going to be interested. So I’ll keep it on-topic 🙂

So what are we talking about then?

Well I didn’t say there wasn’t anything valuable in it! After reading the Yellow Social Media report and thinking on it for a couple of days, and re-reading it there really are only 3 pieces I think you need to know.

1. More Than Before

Quite simply, there’s more businesses than ever with a Social Media presence.

The Report states that for small business it’s 51%, medium is 58% and large is the highest with 85%.

On average 90% of these have Facebook, and they are optimistic about Social Media’s ability to effect their business with 6 in 10 believing it will increase their sales between 11%-16%  in the next year.

2. Adding It Up

According the the Yellow Social Media Report, Australian businesses are spending more on ads, with 52% of respondents declaring they have used paid social and 9/10 reported they had run Facebook Ads.

1 in 3 small businesses are using Social Media advertising, and with medium and large businesses this increases to 1 in 2.

3. We’re Coy About ROI

The findings of the Yellow Social Media Report point to the fact that we don’t really know how to measure our ROI – or return on investment. Which is pretty bad tbh…

Only 21% of small business, 32% of medium and 35% of large businesses measure their ROI!

That’s an average across the business segments of 29%, so only around a third of businesses are actually calculating if the money (and time) they put into their Social Media is making a return.

WOW.

And the ones who do measure their Social Media efforts are looking at likes, followers and subscriber numbers to indicate success – not sales.

But nevertheless they’re saying they’ll spend the same if not more in the coming year…

It’s also outlined in the report that half of businesses Social Media budgets go to paid ads, 1/3rd to content and the rest to management of the platforms – which are overwhelmingly managed in house.

What else?

I did say there were only 3 main takeaways, which I’ve covered – but there’s a couple of minor ones.

One is that interestingly businesses are posting less often than previously recorded (probably due to algorithmic changes making their posts seem less effective) and that businesses are stating that most of the traffic to their Social Media platforms come from the company website.

Which means you need to check your site’s Social Media icons are working, and your Facebook pixel is up and running to track your website users’ journey.

That’s It…

I hope this has been useful and has saved you reading the 30 pages of the Yellow Social Media Report for yourself.

There’s a lot more stats to pour through if you’re inclined, you can read the Part 2 in full here.

TL;DR | 2018 Yellow (the artist formerly known as Sensis) Social Media Report | Part 1

A Yellow rose by any other name…

The much-loved Sensis Social Media Report has changed its name. It’s now the Yellow Social Media Report. But what’s in a name? It’s still going to give you the same delicious stats and facts as always, just with a brighter background.

If you’re into Social Media, or data about the way businesses are using it, this report has something for you!

For the last 2 years I have brought you a TL;DR (Too Long; Didn’t Read) summary of the report, and it’s always one of my most-read posts! This year I’m doing it again. I’ll highlight my main takeaways of the report from my opinion as a Social Media practitioner in regard to the way Western Australian’s and WA businesses are using Social Media.

Why the Yellow Social Media Report?

Why do we love this report so much?

The main reason the Australian Social Media community gets excited about this particular report is because even though there’s a LOT of data out there, it can be tough to find anything that reflects an Australian audience. We’re a big country with a small population and we just aren’t like anyone else.

Another reason is it’s incredibly important to stay up to date in this fast-moving industry. Trends shift in the blink of an eye, and as a Social Media professional (or a small business owner looking after your own businesses Socials) you need to keep up with usage trends to get the best from your efforts.

The Yellow Social Media Report has been asking (mostly) the same questions for the past 7 years, so it’s become somewhat of an authority piece.

Start to Finish

Did you know that the first thing nearly 60% of Australians do every day is use Social Media? It’s how they finish their day, too! I know I’m in that 60%…

62% of Australians use Social Media daily to connect to friends and family – and 60% open their Social Media more than 5 times per day, across an average of 3.5 “internet connected” devices.

Mostly we’re there to connect with people we know – but 44% of Aussies follow brands on Social (up from 25% last year) and they are using your presence to find out more about your business and check your reviews.

Facebook – STILL not dead.

People tell me Facebook is dead. Or that it “doesn’t work for my business” but maybe you’re not giving your audience what it wants, because it’s the most widely used Social Media platform in Australia – consuming an average of 10 hours per week of our time.

94% of Western Australians surveyed use Facebook, and it’s the same as last years result, despite people saying they’re going to #deletefacebook. This is also way out in front of second placed YouTube at 44%.

Yellow Social Media Report - pic 1

Message Me

It’s the same when we move to private messaging services, with Facebook Messenger coming out way in front in WA 79% for Messenger and 30% for Facebook’s other messenger option – WhatsApp. None of the others even came close.

Yellow Social Media Report - pic 2
These are the Australia-wide figures


Live and let LIVE

Us sandgropers are not really embracing Facebook live – with 79% saying they have neither watched nor published a Live broadcast. Are we a bit behind? A bit camera-shy? Maybe we’ll catch up in next years report…

Tell it like it is!

We’re also behind all other states when it comes to publishing Snapchat, Instagram & Facebook Stories with 74% saying they have never published a story on the 3 channels.

Down to Business…

Why do we need to know all this stuff about how people use the platforms? Because it’ll help us as brands get our messages seen and acted on most effectively.

33% of us check out a brand’s social media presence before making our first online purchase from them. WHat if there’s nothing there when they look? Or something old and out of date? Not a good look!

40% of West Aussies said they had provided an online review (we’re the second last state for this – coming in last is SA) and people from the ACT shared the most opinions with 52%.

Only 12% of WA folks said they stopped following a brand in the past year. Mostly they did this because their content was irrelevant or unappealing – or they just posted too often.

Western Australians aren’t very trusting of news on Social Media, with only 20% trusting news on Social Media or news their friends posted on Social Media. We prefer our news on the news, thanks.

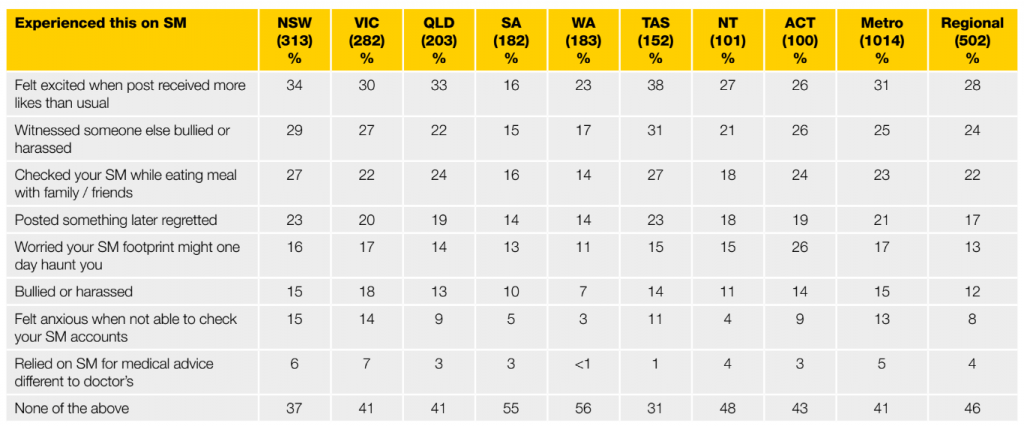
We’re also the state who cares least about likes, and the least likely to check our phones while eating with family and friends, so that’s good news.

Yellow Social Media Report - pic 3

So there you have it – that’s the Part 1 wrap up – Part 2 of the report should be out soon, letting us know more about brands and businesses use of Social Media.


What did you think of my wrapup of the report? Or the Yellow Social Media Report itself? Any surprises?

Want more? You can read the full report here.