Unwrapping the 2016 Sensis Social Media Report [TL;DR]
Sensis release a Social Media report annually, and the reason Aussie Social Media stat nerds like me care is because there’s not a lot of social media reports that analyse purely Australian data. We can be a bit different down here on our island, and real data is real valuable to all Social Media players, the businesses who use it, the people employed by those businesses and the outsourced agency and freelancer folk.
Ultimately, the more you know about the audience demographics, their use, expectations…the things they care about and respond to AND the things that piss them off – the better job you will do at trying to gain attention in an increasingly crowded market.
So here’s the stuff I pulled from their 71 page report that I think will be of value so you don’t have to read the whole thing yourself!
Facebook is not dead!
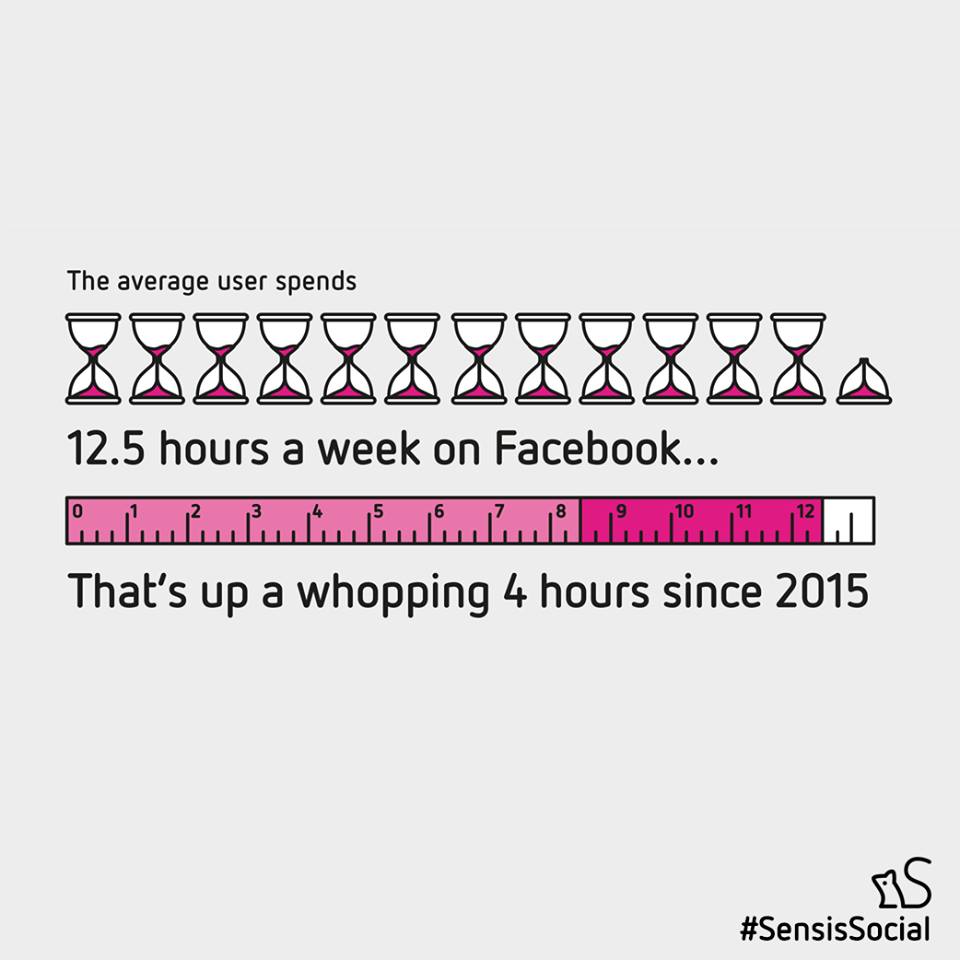
Australians are now spending more than half a day per week (12.5 hours) on Facebook alone, up four hours from last year.
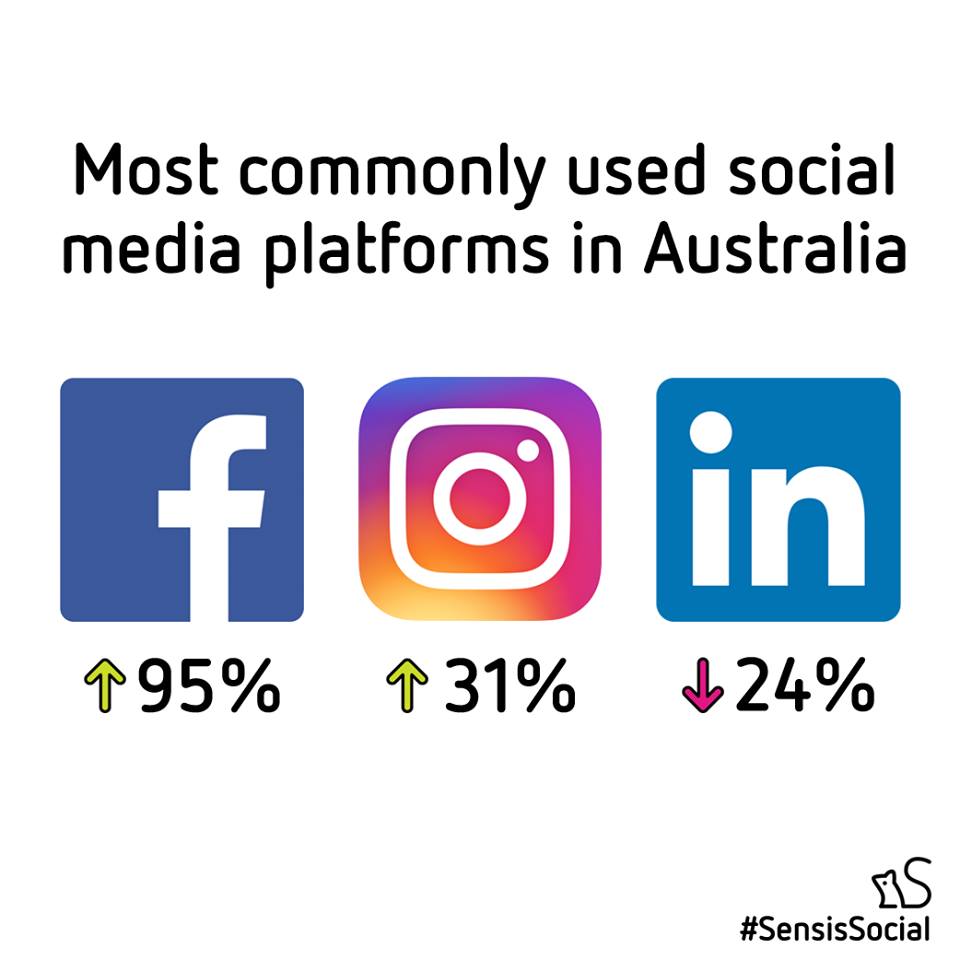
Facebook has maintained its almost ubiquitous appeal – 95% of users. The average number of times people access Facebook has remained relatively steady at 32 times a week, but the amount of time spent on each occasion has increased from 17 to 24 minutes.
My takeaway from this: Anyone who tells you their customers “aren’t on Facebook” could be misinformed. Facebook is by no means dead, and continues its dominance of the Social Media platforms.
Social Media use is increasing!
Instagram (31%) is on a growth trend, almost doubling its reach since 2013. This platform has really captured the younger demographic, used by 58% of 18-29 year olds.
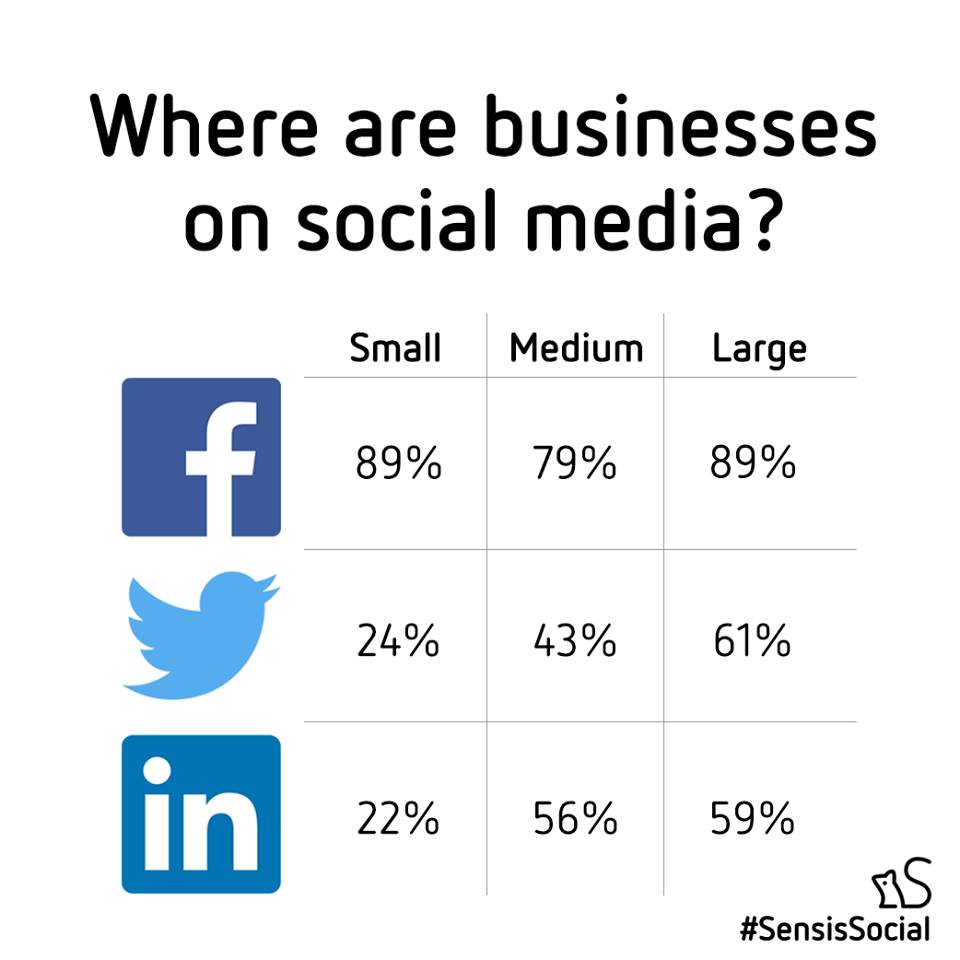
Business Social Media Presence is increasing!
There’s been an upsurge in the number with a social media presence for all business sizes
31% to 48% for small to medium businesses and 56% to 79% for large businesses.
Forty eight percent of small and medium businesses have a social media presence compared with 31% last year, while 79% of large businesses do, which compares with 56% last year.

Over four in 10 medium sized businesses use Twitter (43%), while this figure increases to 61% for large businesses.
Instagram is also reasonably popular among medium (28%) and large (42%) sized businesses.
YouTube (41%) has a similar penetration in large businesses.
Instagram is also now used by over a quarter of medium sized businesses (28%) but its penetration in the small business segment remains much lower (12%).
More businesses now have a social media presence than has previously been recorded. Forty eight percent of small businesses, 54% of medium businesses and 79% of large businesses are now on social media.

Why is this significant?
The businesses that were dragging their feet are realising they are being left behind and launching their Social Media channels.
Social isn’t going away. There are many businesses doing a good job of their Social and brands want this competitive edge for themselves.

The other aspect of this is the longer you wait to get your business on Social Media the harder it’s going to be to find your place in the newsfeed. It’s already a much tougher environment for organic growth than it was when I started using Social Media to drive business 5+ years ago.
You use Social Media differently according to your age group!
No big surprise here.
Visual platforms like Facebook, Instagram and Snapchat are more popular for 18 to 29 year olds, and LinkedIn and Google+ for 40 to 49 year olds.
What does this mean for your business? It’s incredibly important to know who your customers are. You won’t get your messages out to them if you’re not using the right channels. Snapchat might be a huge growth platform right now – but if you sell to people 40+ it’s probably not for you (at least at the moment, doesn’t hurt to reserve your business name though…)
Mobile phones are king!
Smartphones are now the most popular device, overtaking laptops which have lost some appeal.
Why does this matter? Due to the varying functionality and display sizes across desktop and mobile Social Media, make sure your content and Call To Action (CTA) are “mobile-first” meaning, optimised for viewing and use on a phone. It’s important to make your images look appealing on mobile, as this will determine whether people will consume your content.

Australians own an average of three Internet-enabled devices, which underlines our strong appetite for online activity.
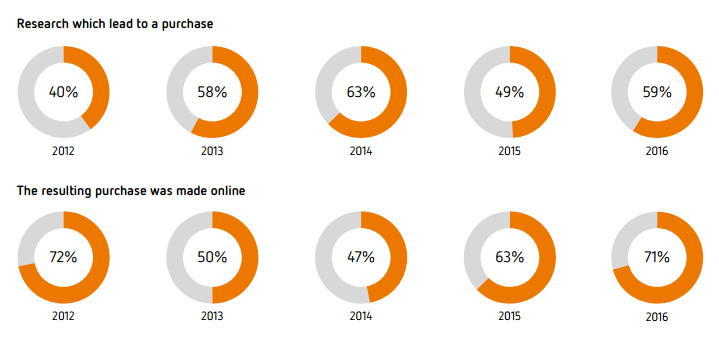
People are still researching businesses on Social Media!
Online blogs and reviews remain a fairly widespread influence on purchasing decisions with 60% of social media users claiming to read them before making a purchase.
Fifty eight percent will look at up to five reviews before making a decision.
Social Media advertising is increasing!
Over eight in 10 of all businesses who advertise on social media have placed an ad on Facebook.

Here’s some WA stats for my local folks!
We don’t take ourselves too seriously!

And we’re a bit gross…

If you want to view the full report here’s a link for you!
One Reply to “Unwrapping the 2016 Sensis Social Media Report”
Comments are closed.