TL;DR | 2018 Yellow (the artist formerly known as Sensis) Social Media Report | Part 1

A Yellow rose by any other name…

The much-loved Sensis Social Media Report has changed its name. It’s now the Yellow Social Media Report. But what’s in a name? It’s still going to give you the same delicious stats and facts as always, just with a brighter background.

If you’re into Social Media, or data about the way businesses are using it, this report has something for you!

For the last 2 years I have brought you a TL;DR (Too Long; Didn’t Read) summary of the report, and it’s always one of my most-read posts! This year I’m doing it again. I’ll highlight my main takeaways of the report from my opinion as a Social Media practitioner in regard to the way Western Australian’s and WA businesses are using Social Media.

Why the Yellow Social Media Report?

Why do we love this report so much?

The main reason the Australian Social Media community gets excited about this particular report is because even though there’s a LOT of data out there, it can be tough to find anything that reflects an Australian audience. We’re a big country with a small population and we just aren’t like anyone else.

Another reason is it’s incredibly important to stay up to date in this fast-moving industry. Trends shift in the blink of an eye, and as a Social Media professional (or a small business owner looking after your own businesses Socials) you need to keep up with usage trends to get the best from your efforts.

The Yellow Social Media Report has been asking (mostly) the same questions for the past 7 years, so it’s become somewhat of an authority piece.

Start to Finish

Did you know that the first thing nearly 60% of Australians do every day is use Social Media? It’s how they finish their day, too! I know I’m in that 60%…

62% of Australians use Social Media daily to connect to friends and family – and 60% open their Social Media more than 5 times per day, across an average of 3.5 “internet connected” devices.

Mostly we’re there to connect with people we know – but 44% of Aussies follow brands on Social (up from 25% last year) and they are using your presence to find out more about your business and check your reviews.

Facebook – STILL not dead.

People tell me Facebook is dead. Or that it “doesn’t work for my business” but maybe you’re not giving your audience what it wants, because it’s the most widely used Social Media platform in Australia – consuming an average of 10 hours per week of our time.

94% of Western Australians surveyed use Facebook, and it’s the same as last years result, despite people saying they’re going to #deletefacebook. This is also way out in front of second placed YouTube at 44%.

Yellow Social Media Report - pic 1

Message Me

It’s the same when we move to private messaging services, with Facebook Messenger coming out way in front in WA 79% for Messenger and 30% for Facebook’s other messenger option – WhatsApp. None of the others even came close.

Yellow Social Media Report - pic 2
These are the Australia-wide figures


Live and let LIVE

Us sandgropers are not really embracing Facebook live – with 79% saying they have neither watched nor published a Live broadcast. Are we a bit behind? A bit camera-shy? Maybe we’ll catch up in next years report…

Tell it like it is!

We’re also behind all other states when it comes to publishing Snapchat, Instagram & Facebook Stories with 74% saying they have never published a story on the 3 channels.
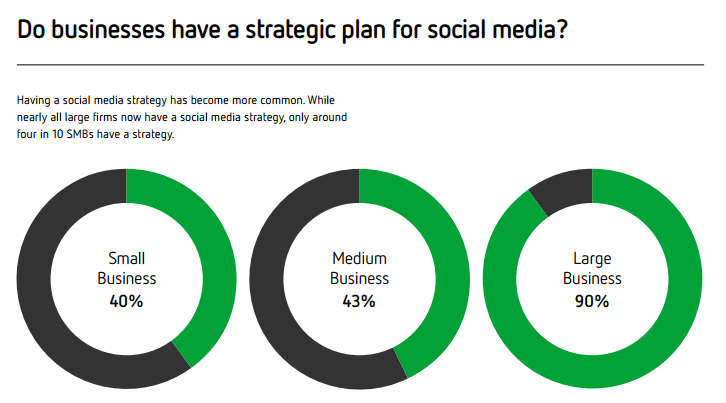
Down to Business…

Why do we need to know all this stuff about how people use the platforms? Because it’ll help us as brands get our messages seen and acted on most effectively.

33% of us check out a brand’s social media presence before making our first online purchase from them. WHat if there’s nothing there when they look? Or something old and out of date? Not a good look!

40% of West Aussies said they had provided an online review (we’re the second last state for this – coming in last is SA) and people from the ACT shared the most opinions with 52%.

Only 12% of WA folks said they stopped following a brand in the past year. Mostly they did this because their content was irrelevant or unappealing – or they just posted too often.

Western Australians aren’t very trusting of news on Social Media, with only 20% trusting news on Social Media or news their friends posted on Social Media. We prefer our news on the news, thanks.

We’re also the state who cares least about likes, and the least likely to check our phones while eating with family and friends, so that’s good news.

Yellow Social Media Report - pic 3

So there you have it – that’s the Part 1 wrap up – Part 2 of the report should be out soon, letting us know more about brands and businesses use of Social Media.


What did you think of my wrapup of the report? Or the Yellow Social Media Report itself? Any surprises?

Want more? You can read the full report here.


TL;DR | 2017 Sensis Social Media Report

It’s that time again!

Sensis has brought us their much anticipated annual Social Media report! If you’re into Social Media, or data about the way businesses are using it, this report is an exciting announcement!

Last year I brought you a TL;DR (Too Long; Didn’t Read) summary of the report, and it was one of my most-read posts! This year I’m doing the same – I’ll highlight my main takeaways of the report from my opinion as a Social Media practitioner in regard to the way Western Australian’s and WA businesses are using Social Media.

Why the Sensis Social Media Report?

But firstly – why is the 2017 Sensis Social Media Report so highly anticipated?  The main reason the Australian Social Media community gets excited about this particular report is because even though there’s a LOT of data out there, it can be tough to find anything that reflects an Australian audience. We’re a big country with a small population and we just aren’t like anyone else.

Another reason is it’s incredibly important to stay up to date in this fast-moving realm. Trends shift in the blink of an eye, and as a Social Media professional (or a small business owner looking after your own businesses Socials) you need to stay abreast of changes and react to get the best from your efforts.

Is it a fad?

With 84% of Australians accessing the internet daily, Social Media is here to stay. 85% of West Aussies have a smartphone, and 67% of people with a smartphone in Australia use it to access the internet more than 5 times a day.

If you’re not concentrating your marketing and indeed, your sales process and customer service online (and in fact mobile-first) you’re getting left behind. Like, already. Not you will get left behind. You are behind.

Facebook – Still not dead.

94% of Western Australians surveyed use Facebook. Way out in front of second place YouTube at 63%. That’s massive – and it’s only dropped 1% since last year, despite people saying they’re not using it anymore.

I hear often that Facebook is dying, Facebook is irrelevant, “my customers aren’t on Facebook” and so on. Well, it’s still our biggest Social Media platform.

sensis social media report

Message Me

It’s the same when we move to private messaging services, with Facebook Messenger coming out way in front in WA, coming out with 89%, in front of it’s next rival, Viber on 41%.

WA People are a funny lot:

  • We’re more likely than any other state to use Social Media at the gym.
  • We’re the equal highest (with Queensland) to publish a live video.
  • We’re more likely to leave an online rating, more likely than any other state to read blogs or online reviews, and we’re more likely to post an online review or blog.
  • And we don’t put up with any shit from our friends! In WA 50% of us have delete friends.


2017 Sensis Social Media Report

Down to Business…

Why do we need to know all this stuff about how people use the platforms? Because it’ll help us as brands get our messages seen and acted on most effectively.

“The survey discovered that the main driver behind social media uptake from businesses is to aid marketing and sales. Providing a line of contact is the next biggest influence.”

You can help your marketing & sales if you aren’t on the right platforms, at the right time, using the right methods to reach the right people. A LOT has to go right, so the more you know the better chance you have of cutting through the noise.

What did we learn?

Not all businesses are on board with Social Media 😮

2017 Sensis Social Media Report

Many of them are not taking advantage of the targeting and availability of paid Social Media

2017 Sensis Social Media Report

In FACT – Social media presence in the business sector in Australia has not grown this year. Just under half the small and medium businesses have a presence. But before we get too excited about this Sensis provide a possible explanation.

in 2016, 17% of the large business sample consisted of businesses with over 1,000 employees, whereas this year only 2% of the businesses have over 1,000 staff and we have seen consistently that businesses with over 1,000 staff almost universally have a social media presence.

Although the report does indicate that 40% of Large Businesses had removed their Social Media profiles. Wow!

In Western Australia SMBs Social Media use has increased against the trend.

2017 sensis social media report

Pay to Play

Social Media advertising is still growing among small and medium businesses and remaining steady in large business if you take into account the data suggests 40% of them deleted their profiles.

2017 Sensis Social Media Report


And it seems much of this budget is used to drive website visits.

The majority of SMBs with a social media presence now have a strategy in place to drive people to their sites – 82% for small, 95% for medium and 97% for large sized businesses.

2017 Sensis Social Media ReportBut aren’t very successful at measuring it. In fact we’re getting worse…

2017 Sensis Social Media Report

2017 Sensis Social Media Report


But we’re getting better at being strategic!

2017 Sensis Social Media Report


Which is great news! We focus our messaging, have an easier time measuring, and become more efficient when we have articulated goals for our Socials.

Did you want to check out the full 81 page report? You can see it here.

So what do you think? Do these results follow your experience in your business?

I’d love to hear about it, so feel free to leave me a comment!